Adobe Stock Analysis: Will They Ever Recover?

An AI chip sitting on top of multiple AI chips

Whether you’re a seasoned investor or just starting out, Adobe is a company that often stands out due to its strong market presence and innovative solutions. In this post, we’ll break down Adobe’s key financial metrics, business model, and valuation methods to help you determine whether Adobe is a worthwhile addition to your investment portfolio.

Watch the full analysis

What’s in the News for Adobe?

Adobe recently made headlines with its Q3 earnings report. The company generated $5.4 billion in revenue, marking an 11% year-over-year increase, with earnings per share (EPS) rising to $11.85. Despite these strong numbers, Adobe’s stock saw a 9% dip after the earnings call. The market reaction suggests that investors might feel Adobe is currently overvalued, especially considering the competitive landscape and rising AI technologies.

CEO Shantanu Narayen emphasized the company’s “relentless innovation” as a key driver behind its success, but it’s clear the market has some reservations about Adobe’s future growth, which brings us to an in-depth analysis.

Adobe’s Fundamentals: A Closer Look

Adobe’s financials have long been a strong selling point for investors. Let’s break down some of the company’s key financial metrics:

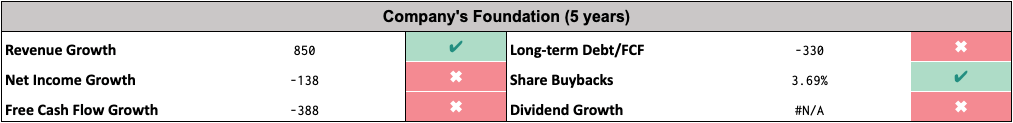
  • Average Revenue Growth: Adobe has a history of solid revenue growth. However, the company’s forecast for 2024 shows a projected slowdown, with expected growth at just 3%.
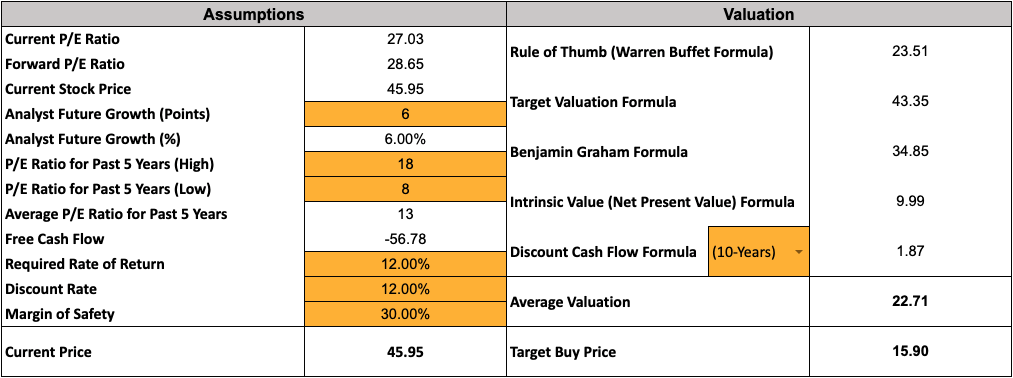
  • PE Ratio: Currently, Adobe’s price-to-earnings (PE) ratio is around 46, slightly below its earlier value of 50 but still above the industry average of 41. This could indicate that Adobe is trading at a premium, particularly compared to its competitors.
  • Profit Margins: Adobe boasts high gross profit margins of over 55%, thanks to its strong subscription model and product ecosystem.
  • Free Cash Flow: Adobe’s cash flow remains stable, a key indicator of the company’s ability to reinvest and grow while maintaining profitability.
  • Debt Coverage: Adobe has low long-term debt, and its free cash flow easily covers any liabilities, making the company financially secure.

Key Ratios That Matter

For investors, there are several critical ratios to watch when analyzing Adobe:

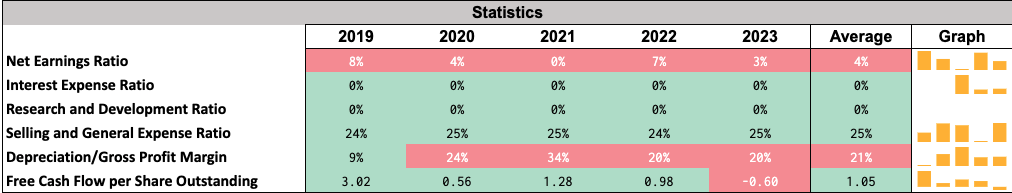
  • Net Earnings Ratio: Adobe’s net profit margin stands at approximately 30%, a solid indicator of its operational efficiency and profitability.
  • R&D ratio: Adobe has a stable 20% R&D ratio which might indicate a good competitive advantage. However, it is unclear where this money is spent and how it benefits the company.

Understanding Adobe’s Business Model

Adobe’s subscription-based business model has been the backbone of its success. The company’s Creative Cloud suite is a must-have for industries ranging from marketing to design, and its Document Cloud (featuring products like Adobe Acrobat) continues to be a market leader.

This recurring revenue model provides predictable cash flows, making Adobe a stable investment in the tech sector. However, the company is facing rising competition from AI-powered creative tools, which may pose a challenge to its market share moving forward.

Valuation Methods: How We Evaluate Adobe Stock

1. Discounted Cash Flow (DCF) Analysis

The discounted cash flow method estimates the present value of Adobe’s future cash flows, factoring in its efficiency and operational excellence. Here’s how we break it down:

  • Projected Free Cash Flow Growth: We assume McDonald’s free cash flow growth will be 7% annually. This is a conservative estimate due to competition Adobe is facing with new AI softwares popping up. This figure is also in line with the past 5 years of revenue growth.
  • Discount Rate: For DCF, we typically use a discount rate of 10%, which accounts for the risk of investing in individual stocks versus the broader market.
  • Valuation: Based on the DCF model, McDonald’s intrinsic value is estimated at $80 per share.

2. Benjamin Graham’s Formula

The formula of Benjamin Graham mainly focusses on the growth rate and the company’s current EPS ratio. According to this formula, Adobe should be priced around $86.

3. Warren Buffett’s Rule of Thumb Formula

Similar to the Benjamin Graham Formula, the rule of thumb formula uses the same input however it undermines the 4.4% high yield bond rate that Benjamin included. Therefor this valuation is always slightly higher and prices the stock at around $118.

4. Target Valuation Formula

This formula emphasizes on the current EPS, an estimated P/E Ratio, growth rate and the period you are planning on holding the stock. This formula returned a valuation of $501

5. Intrinsic Value (NPV) Formula

This formula is a bit more elaborate and includes the cashflow, discount rate, number of periods, and residual value. This formula returned a price of $240.

Average valuation

Most statisticians know that the average is (almost) always right. Therefore, we are interested in what the average of all five formulas is. The average of all the formulas that we used is $205which is a lot higher than the price it is currently trading for ($536).

Now let’s dive deeper into the various valuation methods we use to assess whether McDonald’s stock is priced fairly.

Should You Invest in Adobe?

While Adobe remains a solid company with a strong business model, its current stock price appears to be higher than its intrinsic value based on multiple valuation methods. The growing competition from AI tools, coupled with a slowing growth rate, may raise concerns about whether Adobe can sustain its premium price.

If you’re a long-term investor with a focus on stable companies, Adobe could still be a good pick. However, waiting for the stock to come closer to its intrinsic value might be a more prudent strategy.

Conclusion

Adobe is a market leader with impressive financials and a subscription model that ensures stable cash flow. However, based on our analysis, the stock appears to be overvalued at current prices. Keeping Adobe on your watchlist and waiting for a better entry point could be the best move for value-focused investors.

As always, do your own research and consider your investment strategy before making any decisions.

The Ultimate McDonald’s Stock Analysis: Is It Worth the Investment?

A woman is walking up to an American style Mc Donalds.

Whether you’re a seasoned investor or new to the market, McDonald’s is a popular stock that often catches the eye due to its robust fundamentals and iconic global presence. In this post, we’ll analyze the company’s key financial metrics, business model, and valuation methods to help you decide if McDonald’s is a worthy investment for your portfolio.

Watch the full analysis

What’s in the News for McDonald’s?

McDonald’s has made headlines recently, particularly during the U.S. election season. There’s been buzz around a claim made by one of the presidential candidates that they worked at McDonald’s. This news, although it might seem trivial, keeps the company in the media spotlight. As election debates heat up, McDonald’s remains a topic of discussion, making it an interesting time to evaluate its stock.

McDonald’s Fundamentals: A Closer Look

McDonald’s fundamentals remain strong, and that’s why the stock has maintained its appeal over the years. Let’s break down some of the key metrics:

  • Dividend Yield: McDonald’s boasts a healthy dividend yield of 2.1%. Additionally, with a dividend payout ratio of 53%, the company appears to be on solid financial footing, distributing consistent returns to its shareholders.
  • PE Ratio: The company’s PE ratio is currently at 21, which is in line with industry standards, particularly when compared to other consumer goods giants like Starbucks.
  • Profit Margins: McDonald’s gross profit margin of 55% and operating margin of 53% demonstrate the efficiency of the business. Their ability to optimize operations, coupled with the strength of their brand, contributes significantly to these figures.

Key Ratios That Matter

For investors, several key ratios can provide insights into McDonald’s operational efficiency and potential for future growth:

  • Net Earnings Ratio: Over 20%—a strong indicator of profitability.
  • Debt Coverage: McDonald’s long-term debt is covered by its free cash flow, at a rate of 5 times, showing strong financial health.
  • Share Buybacks: McDonald’s has consistently bought back shares, increasing the value for existing shareholders. In fact, 15.75% of shares have been repurchased recently—a positive sign for investors.

Understanding McDonald’s Business Model

One of the key factors behind McDonald’s success is its franchise model. Around 95% of McDonald’s locations are franchises, which means the company earns steady, recurring revenue through franchise fees while keeping operational costs low. McDonald’s typically owns the land on which these franchises operate, creating a dual revenue stream from both real estate and franchise operations.

This business model makes McDonald’s a reliable cash generator and positions it as a long-term player in the fast food industry.

Valuation Methods: How We Evaluate McDonald’s Stock

Now let’s dive deeper into the various valuation methods we use to assess whether McDonald’s stock is priced fairly.

1. Discounted Cash Flow (DCF) Analysis

The discounted cash flow method estimates the present value of McDonald’s future cash flows, factoring in its efficiency and operational excellence. Here’s how we break it down:

  • Projected Free Cash Flow Growth: We assume McDonald’s free cash flow growth will be 10-15% annually due to its robust operational efficiency.
  • Discount Rate: For DCF, we typically use a discount rate of 10%, which accounts for the risk of investing in individual stocks versus the broader market.
  • Valuation: Based on the DCF model, McDonald’s intrinsic value is estimated at $157 per share.

2. Benjamin Graham’s Formula

The formula of Benjamin Graham mainly focusses on the growth rate and the company’s current EPS ratio. According to this formula, Mc Donalds should be priced around $102.

3. Warren Buffett’s Rule of Thumb Formula

Similar to the Benjamin Graham Formula, the rule of thumb formula uses the same input however it undermines the 4.4% high yield bond rate that Benjamin included. Therefor this valuation is always slightly higher and prices the stock at around $146.

4. Target Valuation Formula

This formula emphasizes on the current EPS, an estimated P/E Ratio, growth rate and the period you are planning on holding the stock. This formula returned a valuation of $263

5. Intrinsic Value (NPV) Formula

This formula is a bit more elaborate and includes the cashflow, discount rate, number of periods, and residual value. This formula returned a price of $118.

Average valuation

Most statisticians know that the average is (almost) always right. Therefore, we are interested in what the average of all five formulas is. The average of all the formulas that we used is $157.63 which is a lot higher than the price it is currently trading for ($289).

Now let’s dive deeper into the various valuation methods we use to assess whether McDonald’s stock is priced fairly.

Should You Invest in McDonald’s?

While McDonald’s is a household name with an exceptional business model and solid fundamentals, its current stock price suggests it might be overvalued. However, if you’re a dividend-focused investor or looking for a stable, long-term addition to your portfolio, McDonald’s is certainly worth considering—especially if the stock price dips to more reasonable levels. But keep in mind that this valuation is based on our assumptions and should not be taken as financial advise.

Conclusion

McDonald’s is a well-established brand with strong financials, making it a potentially attractive stock for long-term investors. However, based on various valuation methods, McDonald’s appears to be overvalued at its current market price. It might be a good idea to keep the stock on your watchlist and consider purchasing when prices align more closely with its intrinsic value.

As always, do your own due diligence before making any investment decisions. If McDonald’s stock aligns with your investment strategy, it could become a valuable asset in your portfolio for years to come.

How US Elections Impact the Stock Market: What Investors Should Know

The facade of capitol hill Washington DC United States.

As the US prepares for its upcoming elections, both investors and market analysts are closely watching how these political shifts could affect the stock market. Elections have historically played a pivotal role in shaping the performance of indices like the S&P 500 and the broader US economy. In this post, we will dive deep into the relationship between election cycles and stock market volatility, offering insights for investors on how to position their portfolios during such times.

Watch the full analysis

Historical Stock Market Trends During Election Years

One of the first things to understand about elections is how the stock market has historically responded during election years. According to long-term data, the S&P 500 gains an average of 7% during election years since 1952. However, this performance is notably lower than the 17.7% average gain in the year prior to elections, indicating that market volatility tends to increase during the election cycle.

Key Takeaway: Investors should expect more volatility during election years, which can lead to a shift in the market’s overall performance.

Republican vs. Democratic Impact on Stock Performance

Research from Morgan Stanley reveals an interesting dynamic: the S&P 500’s average return when a Republican president is elected stands at 15.3%, compared to 7.6% under a Democratic administration. While this trend favors Republican leadership from an investment return perspective, Democratic policies tend to impose more regulation and taxation, especially on large corporations, which can curb short-term market gains.

Table showing the different outcomes of winning parties US precedential elections

Key Takeaway: Investors should weigh potential policy changes when adjusting portfolios, as Republican-led economies typically result in higher stock market returns, while Democrats focus more on corporate regulation and taxation.

Sectoral Winners and Losers During Election Cycles

One of the most notable examples of election-driven market movements occurred when President Biden entered office, promising aggressive support for green energy initiatives. As a result, stocks related to green energy skyrocketed in value. However, those gains were short-lived, as many of these stocks later hit rock-bottom prices.

Similarly, investors should note that increased taxes on corporate share buybacks—a policy Biden has pushed through as part of the Inflation Reduction Act—could have a detrimental effect on the overall market. For instance, companies like Nvidia recently announced a $15 billion share buyback, which could become significantly costlier under such tax policies.

Key Takeaway: Keep a close eye on sectoral shifts. Energy, tech, and manufacturing sectors could experience significant gains or losses depending on the candidate’s policies.

The Risk of a US Recession During Election Years

It’s also crucial to note that 54% of election years have overlapped with officially declared recessions, according to the National Bureau of Economic Research. The combination of an unstable economy, potential changes in policy, and stock market reactions makes it vital for investors to prepare for a possible downturn.

Key Takeaway: Recessions have frequently coincided with election cycles. Investors should consider hedging their portfolios or diversifying into safer assets like long-term treasuries or gold.

How to Adjust Your Investment Strategy During Elections

To navigate the volatility that elections can bring to the stock market, it’s essential for investors to make adjustments to their portfolios. Here are some actionable strategies:

  1. Diversify with Safe-Haven Assets: Stocks like Coca-Cola or stable commodities like gold offer protection during uncertain times.
  2. Consider Shorting Volatile Indices: As we’ve done previously, shorting indices like the S&P 500 can be a smart hedge if you expect increased volatility.
  3. Look at Long-Term Government Treasuries: With interest rates likely to decline post-election, long-term treasuries may become a valuable part of your portfolio.
  4. Be Patient with High Valuation Stocks: Many high-growth companies may currently be overpriced, leading to potential corrections. Staying cautious and keeping cash on hand could help take advantage of future market dips.

Key Takeaway: Prepare your portfolio for election-related volatility by incorporating safe assets, shorting volatile indices, and considering long-term plays in bonds and undervalued stocks.

Conclusion

Both Republican and Democratic policies have the potential to significantly alter the landscape of the US economy and the stock market. Investors need to stay informed and proactive, as increased volatility and potential recessions during election periods are common. Whether through hedging strategies, diversifying into safer assets, or capitalizing on long-term opportunities, it’s crucial to adjust your portfolio to navigate these uncertain times.

Starbucks Stock: A Closer Look Under Its New CEO

A man sitting behind his laptop in a Starbucks store

In this post, we’re diving into a hot topic that’s been making headlines: Starbucks stock and why some analysts think it could more than double under its new CEO. Let’s break down the details and reevaluate the situation now that some time has passed since the initial buzz.

Watch the full analysis

The Big News: Starbucks’ New CEO

A couple of weeks ago, Starbucks announced a new CEO, which sent its stock soaring. Interestingly, we had just filmed a video evaluating Starbucks before the news hit. Once the CEO announcement dropped, the stock price jumped by 25%. So, now that the dust has settled, it’s time to take a step back and reassess Starbucks’ fundamentals.

Under the new CEO’s leadership at his previous company, Chipotle, stock prices soared sevenfold. While that’s impressive, the question remains: can he replicate that success at Starbucks? For context, during his time at Chipotle, the CEO also opened about 1,000 new stores globally and introduced new technologies. While those innovations are noteworthy, it’s essential to ask whether they’re needed at a company like Starbucks, especially since the coffee chain already has a strong global presence.

Financial Overview

Let’s dive into Starbucks’ fundamentals. Starbucks is a strong brand with a solid history, but the market for coffee chains is quite saturated. Its revenue and free cash flow growth haven’t been particularly exciting lately, and competition is rising, especially in major markets like China, where competitors like Luckin Coffee are making strides.

Despite this, Starbucks is aggressively buying back shares, which is generally good for investors. However, the real question is whether these buybacks are being made at the right time. While Starbucks’ dividend growth is modest, its overall financials—such as a PE ratio of 21.5, a dividend yield of 2.3%, and return on invested capital—are solid for a coffee chain.

When it comes to key financial ratios, nothing jumps out as overly alarming. The selling and general expenses ratio is below 20%, which is great for a company like Starbucks. This shows that the brand is so strong that it doesn’t need to spend heavily on marketing to maintain its position. However, there was some buzz about the new CEO’s use of private jets, which might push these expenses higher in the coming years.

Valuation: Is Starbucks Still a Good Buy?

When it comes to valuation, we use a discount model to project Starbucks’ potential value over the next 10-15 years. One thing to remember is the impact of new store openings. Starbucks has already penetrated most markets, so it’s uncertain how many more new stores can be opened in lucrative areas. Nonetheless, investors seem hopeful that the new CEO might tap into fresh opportunities in untapped markets, which could drive future growth.

Looking at the numbers, if we assume a 6% growth rate over the next 10 years, Starbucks stock might be a solid long-term hold. However, with a more optimistic 10% growth rate, the value projection is even higher. But again, that’s assuming everything goes perfectly under the new leadership.

For now, Starbucks’ PE ratio is hovering around 22, which is reasonable compared to its industry. However, the spike in stock price after the CEO announcement feels overblown. The CEO hasn’t made any concrete changes yet, and paying a premium based on potential alone is risky.

Our Verdict

We always emphasize sticking to the facts and avoiding hype. Starbucks is a solid, stable brand, but at its current valuation, it seems investors are banking heavily on the new CEO delivering something spectacular. While Starbucks has some growth potential, especially with store expansions in new markets, we urge caution before jumping on board just because of leadership changes.

The takeaway? Stick to the fundamentals. Right now, Starbucks is a bit overpriced based on what’s actually changed, which, for now, is just the new CEO walking into the office.

Final Thoughts

Stock markets can often be driven by news and emotion. However, staying grounded and focusing on data is the key to smart investing. At the moment, it seems like Starbucks might be a great company but at a price that’s hard to justify based on the facts we have today.

Thanks for reading, and until next time—happy investing!

Nvidia Stock Plummets 8% Despite Strong Growth – Is It Overvalued? Here’s What Investors Need to Know!

Nvidia has been making headlines recently due to its business growth and stock performance. Although the company has demonstrated robust growth, its stock price has been a topic of debate among investors. In this article, we’ll break down Nvidia’s financial performance, market valuation, and potential future prospects to determine if its stock is truly overvalued.

Watch the full analysis

Nvidia’s Impressive Business Growth

Nvidia has shown exceptional business growth, exceeding market expectations. In the latest quarter, Nvidia reported strong financial results with a significant increase in revenue. However, despite these impressive numbers, the stock price fell by 8% following the earnings report. This drop can be attributed to the high expectations set by the market.

The company has a current market capitalization of $2.66 trillion, and its price-to-earnings (P/E) ratio stands at around 60. In comparison, the semiconductor industry average P/E ratio is approximately 35. This high valuation reflects the market’s expectations for Nvidia’s continued high growth, particularly in sectors like AI, gaming, and data centers.

Understanding Nvidia’s Valuation

Nvidia’s high valuation has sparked discussions among investors. With a P/E ratio nearly double the industry average, the question arises: is Nvidia overvalued? A company’s P/E ratio should ideally be in line with its growth rate. Nvidia’s revenue growth rate has been around 47% over the past eight years, and its free cash flow growth has surpassed 100%, which justifies a higher valuation.

However, a comparison with the broader semiconductor industry, which has a much lower average P/E ratio, indicates that Nvidia’s stock could be considered overvalued. Following the principles of investment gurus like Peter Lynch, a P/E ratio should correlate with the company’s growth rate, which, in Nvidia’s case, might signal overvaluation.

Nvidia’s Strong Market Position and Competitive Advantages

Nvidia is a market leader in several key segments, including AI chips, gaming GPUs, and data center solutions. The company’s products are renowned for their performance, and Nvidia enjoys a competitive edge over rivals like AMD and Intel. This dominant position in the market is further strengthened by Nvidia’s strong brand reputation, which drives consistent demand for its products.

The company’s gross margins are nearly 80%, which is impressive, especially for a hardware-focused business. Operating margins are around 65%, which highlights Nvidia’s operational efficiency and profitability. These metrics underline Nvidia’s ability to maintain healthy profit margins, contributing to its high valuation.

R&D and Technological Innovation

Nvidia has maintained a robust investment in research and development (R&D). In recent years, Nvidia has spent around 20% of its revenue on R&D, which has enabled the company to innovate and maintain its technological leadership. This is lower than the typical R&D expenditure for tech companies, indicating that Nvidia has successfully leveraged its existing technologies while minimizing the need for excessive spending.

Nvidia’s strong R&D investments have also helped it establish a moat, or a competitive advantage, around its business. This has made it difficult for new competitors to enter the market and challenge Nvidia’s dominance, ensuring the company’s sustained growth in the future.

Financial Health and Shareholder Returns

Nvidia’s financial health is solid, with manageable debt levels and strong free cash flow generation. The company’s long-term debt stands at $5.5 billion, which Nvidia can easily cover with its annual free cash flow of $27 billion. This financial strength allows Nvidia to invest in growth opportunities and return capital to shareholders.

Recently, Nvidia announced a $15 billion share buyback program, which indicates management’s confidence in the company’s future prospects. Share buybacks also help reduce share dilution and enhance shareholder value. Additionally, Nvidia has started issuing dividends, further solidifying its commitment to returning value to shareholders.

Future Growth Prospects

Looking ahead, Nvidia’s growth will be driven by several key factors:

  1. Artificial Intelligence (AI): Nvidia is a leader in AI hardware and software, which positions the company well to capitalize on the growing demand for AI solutions. The company’s GPUs are widely used in AI training and inference, making Nvidia a critical player in the AI ecosystem.
  2. Gaming: Nvidia’s GPUs are popular among gamers for their high performance. As the gaming industry continues to grow, driven by advancements in graphics technology and the increasing popularity of eSports, Nvidia’s gaming segment is expected to remain strong.
  3. Data Centers: Nvidia’s data center business is another growth driver. The company’s GPUs are used in servers for high-performance computing, cloud gaming, and AI applications. The increasing adoption of cloud services and the need for powerful data center infrastructure will continue to support Nvidia’s growth in this segment.

However, investors should consider the potential challenges Nvidia may face. The semiconductor industry is highly competitive, with companies like AMD, Intel, and emerging players constantly innovating. Additionally, macroeconomic factors such as interest rates, inflation, and global supply chain disruptions could impact Nvidia’s growth trajectory.

Conclusion

Nvidia is undoubtedly a well-managed company with strong financials and a dominant position in key growth areas like AI, gaming, and data centers. However, its current valuation, with a P/E ratio significantly higher than the industry average, suggests that the stock may be overvalued. Investors need to weigh the company’s strong growth prospects against its high valuation and consider whether Nvidia can continue to meet the market’s lofty expectations.

In conclusion, while Nvidia remains a leader in the semiconductor industry with promising growth potential, investors should approach its stock with caution and conduct thorough due diligence before making investment decisions. Balancing the potential for high returns with the inherent risks is key to navigating the dynamic landscape of Nvidia’s stock performance.

How Powell’s Announcement on Lowering Interest Rates Could Impact Your Investments

A piggy bank surrounded by gold coins and coins dropping into the bank

We’re diving into a significant development in the financial world. It’s essentially a code-red moment because Jerome Powell, the Chairman of the Federal Reserve, made an important announcement that has the potential to reshape the market. As reported on Yahoo Finance, Powell emphasized that “the time has come for policy to adjust.” This statement centers around a potential shift in interest rates, specifically a move to lower them. This decision comes as inflation seems to be under control, and the labor market appears to be softening. Let’s discuss what this means for your investments, particularly for the S&P 500 and the broader global economy.

Watch the video for the full analysis

The Implications of Lowering Interest Rates

The lowering of interest rates is a crucial topic for investors. When interest rates decrease, borrowing becomes cheaper, making money more accessible. Historically, this situation has often led to a decline in the S&P 500. Contrary to what some might expect, the S&P 500 doesn’t usually fall when rates are high; rather, it tends to drop when the rates begin to go down. This pattern has been observed in past economic cycles, such as in July 2000 and again in 2007.

One notable exception was in 2019, when interest rates were lowered, but the market did not follow the same pattern. This deviation was primarily due to government stimulus measures, often referred to as “helicopter money,” which artificially boosted the market.

How Will This Affect Your Investments?

Understanding the correlation between interest rates and stock market performance is essential for any investor. As history suggests, when the Federal Reserve reduces the federal funds rate, it can signal a cooling-off period for the market. This shift doesn’t happen overnight; there’s typically a lag of about six months to a year before the effects of cheaper debt are felt by businesses and consumers. During this time, stock valuations may face corrections.

One example of this cautious approach is Warren Buffett’s strategy. He has been increasingly investing in treasuries, which are considered safer investments during periods of market overvaluation. It’s not just about seeking profits but about preserving capital when everything else seems overpriced.

Using Tools to Navigate Market Changes

For those wondering how to stay ahead in these unpredictable times, utilizing analytical tools like our 9-Thirty app can be invaluable. The app includes a macroeconomic dashboard that tracks various indicators such as the government debt-to-GDP ratio, GDP growth rates, federal funds rate, and inflation. By using these tools, investors can make informed decisions based on real-time data.

What to Expect Moving Forward

As Powell’s announcement suggests, a reduction in interest rates could soon be on the horizon. However, investors should brace themselves for potential market corrections. While the initial reaction to lower rates might be optimism, the historical data indicates that the real impact on the S&P 500 and other stock indices might be a decline. This potential downturn underscores the importance of being cautious and prepared.

As always, it’s vital to diversify your portfolio, monitor market conditions closely, and use reliable tools to track economic indicators. By doing so, you can position yourself to take advantage of market opportunities when valuations become more reasonable.

Conclusion: Stay Informed and Be Prepared

In conclusion, while lower interest rates might sound like a positive development, they could also signal a period of market correction. As pointed out, there is a lag before the effects of lower rates are felt in the broader economy, and during this time, careful observation and strategic planning are essential.

Why Warren Buffett Is Selling Apple: A Deep Dive into Berkshire Hathaway’s Investment Strategy

When Warren Buffett, one of the most revered investors of our time, makes a significant move in the stock market, the world takes notice. Recently, Buffett’s decision to sell a large portion of Berkshire Hathaway’s Apple holdings has sparked curiosity and debate among investors and financial analysts. In this blog post, we’ll explore the reasons behind this decision, delve into Apple’s financials, and provide a valuation based on our analysis

Warren Buffett’s Apple Sell-Off: What’s Behind the Decision?

In the last quarter of 2023, Buffett began trimming his Apple position, citing concerns about potential corporate tax increases in the U.S. While initially, this reduction seemed minor, Buffett has since drastically reduced Berkshire Hathaway’s Apple shares by 55%, from 95 million shares in December 2023 to 40 million shares. This raises the question: why is Buffett, who has famously praised Apple, selling such a significant portion of his stake?

A Shift in Strategy: Cash is King

One clue lies in Buffett’s increasing preference for short-term treasury bills, which now outpace the holdings of even the Federal Reserve. With yields around 5%, Buffett is stockpiling cash, suggesting he anticipates potential market turbulence or is waiting for more favorable investment opportunities. This move is not unprecedented for Buffett, who is known to accumulate cash when he believes stock valuations are too high or when he can’t find compelling investment opportunities.

Apple’s Financial Performance: A Closer Look

Apple remains one of the world’s most profitable companies, but a deeper analysis reveals some areas of concern that might have influenced Buffett’s decision:

  • Revenue Growth: Apple’s revenue growth has slowed, particularly after 2022, where the company only achieved 8% growth. The higher interest rate environment and a more cautious consumer base are contributing factors.
  • Debt Levels: Despite Apple’s robust cash flow, its debt levels have remained relatively stable. Apple has taken on debt, especially during the low-interest-rate environment of the COVID-19 pandemic, often using it for stock buybacks rather than reinvestment in growth initiatives.
  • Product Saturation: Apple’s product lines, particularly the iPhone, have reached a saturation point. The incremental updates in new models are less compelling, and the growth rate in this segment is slowing. Even Apple’s services, which have been a significant revenue driver, may be approaching their growth ceiling.

Is Apple Overvalued?

When analyzing Apple’s valuation, several metrics are crucial:

  • Price-to-Earnings (P/E) Ratio: Apple’s current P/E ratio is around 29, which is below the tech industry average of 34. However, this doesn’t necessarily mean Apple is undervalued. Given the company’s slower growth and potential for future stagnation, this ratio may be inflated.
  • Free Cash Flow Growth: Over the past five years, Apple’s free cash flow growth has averaged around 9.5%. However, recent years have seen this figure stagnate, casting doubt on whether the company can sustain such growth moving forward.
  • Projected Growth: Analysts optimistically predict a 20% annual growth rate for Apple over the next five years. Yet, given the current market conditions and Apple’s own performance history, a more conservative estimate would be around 9%, if not lower.

Valuation Analysis: What is Apple Really Worth?

Using a discount rate of 10% and factoring in Apple’s current financials, our analysis suggests that Apple is currently overvalued. With a target buy price of around $84.3 per share, compared to its current price of approximately $209, investors might want to reconsider purchasing Apple at current levels.

Why Buffett is Moving On

Buffett’s decision to sell Apple seems driven by both valuation concerns and strategic portfolio management. Apple, while still a cash-generating giant, may no longer offer the growth potential that once made it a cornerstone of Berkshire Hathaway’s portfolio. By selling now, Buffett is likely locking in significant profits while reallocating capital to more promising opportunities, as signaled by his massive accumulation of treasury bills.

Conclusion

Warren Buffett’s recent moves with Apple should not be seen as a lack of faith in the company but rather a reflection of disciplined investment strategy. Apple’s fundamentals remain strong, but at its current valuation, the stock may not offer the risk-adjusted returns that Buffett seeks. As always, investors should do their due diligence and consider whether Apple’s stock price accurately reflects its future growth prospects.

Want to have more insights? Watch our deep dive valuation on Apple.

Our 5-step value investing process

Closed urban outfitter shop

As we discussed in our previous post, there are a lot of factors to consider when you start your value-investing journey. In this article, we outline our 5 steps to making a purchase decision. Ready? Let’s go!

1. Find industries within your comfort zone

The first step is to find companies that you are interested in investing in. One of the tips Peter Lynch gave in his best-selling book “One Up On Wall Street: How to Use What You Already Know to Make Money in the Market” is to find an industry that is close to your work or interests. In my short professional career, I have been working in the travel, finance, consumer goods, and advertising industry. These are the industries I know most about, and keep regular tabs on which makes it a great place to start. Are there any companies that you know perform well, but are out of the spotlight. Have you heard rummors of a potential acquisition of your favourite clothing brand by a bigger player? These are the starting point of finding hidden gems!

2. Indicate companies that might be undervalued

This step might be a bit harder. There are so many indicators of a good company by just looking at various ratios. Our personal favorite is the PE ratio. Considering that the market average PE ratio is between 20-25, anything under that might indicate a good opportunity so swoop it up in your portfolio. For this case study we will use Urban Outfitters ($COLM). At the time of writing this article, the PE ratio is around 18.0.

3. Check company financial health and foundation

Some important metrics to consider:

  • Has the company been growing their revenue?
  • Has the company been growing their net income?
  • Has the company been growing their net income?
  • Is the company’s long-term debt covered by their free cash flow?
  • Is the company diluting it’s shareholders?
  • Have they been growing their dividends?

Our tool will answer all these questions for you in a wink of an eye:

This by itself does not provide you with the full picture, but if you are searching for high-quality companies, this first step will tell you whether to keep investigating this company or move on! For the sake of this article, we will continue with Urban Outfitters.

The following questions you should now ask yourself are regarding the competitive advantage of the company.

  • Are they able to transform revenue into profits?
  • What is their interest expense ratio?
  • Does the company invest heavily into R&D?
  • Is it easy to sell the products, meaning, do they have a low Selling and General Expense Ratio?
  • Do they have a lot of inventory which is depreciating?

Again, our sheet does the math for you!

There is some good, some bad, and some ugly. First, they are not able to transform their revenue into profits, which leaves some room for the optimization of the business model. This is not what we are looking for, we are looking for businesses with good 20%+ Net Earnings Ratios.

The interest expense ratio is good. Research and Development Ratio of 0% is good. Any company with a Research and Development Ratio below 20% is considered good. This is because they have products and services that people want and they do not have to develop this further.

Selling and General Expense Ratio is a bit on the high side. This ratio explains that they need to invest on average 25% of their budget into marketing to move products. We would like this ratio to be below 20%.

The depreciation of gross profit margins should ring alarm bells. Urban Outfitters has an average yearly depreciation ratio of 21%! This might be an indication that they consistently have a lot of unsold items still in inventory.

4. Put a price on the stock

By now, I would probably have stopped investigating this company. But for the sake of this article, we will dive deeper into the valuation mechanics of our tool.

First, we need to know the average expected growth per year. We can find analysts’ opinions on Yahoo Finance. They estimate an average yearly growth of 27% for the next five years… I find that hard to believe. Looking at the average revenue growth of the past 5 years, they have increased their revenue by 6% which is probably more realistic.

Next, we need to find their average P/E of the past years. We can use Macro Trends to help us to estimate this number. Ignoring the outliers, they had a high PE of around 18, and a low of 8, which would give us an average P/E ratio of 13.

Our tool returns an average valuation of 22.71$, and a target buy price of 15.9 considering a margin of safety of 30%

5. Buy or pass on the stock and repeat.

In this example, we would probably skip on the stock. The company’s foundations are not attractive, and the current price is three times as high as where you might want to consider buying.

Concluding remarks

Does this process appeal to you? Good news, you can acquire our tool today!

About value investing

Man sitting on pile of cash learning about value investing

Value investing is a popular investment strategy that has been used by many successful investors to achieve long-term financial gains. In this blog post, we will take a closer look at what value investing is, its principles, and how you can apply it to your own investments.

Value investing is an investment strategy that involves identifying companies whose stock price is undervalued by the market. This approach is based on the idea that the market sometimes undervalues companies that have strong fundamentals, such as a strong balance sheet, healthy cash flow, and a good earnings history. The goal of value investing is to find these undervalued stocks and hold them for a long time until the market realizes their true value, resulting in a substantial return on investment.

Principles of Value Investing

Value investors follow several key principles when identifying stocks to invest in. These principles include:

  1. Margin of Safety: The concept of margin of safety is a fundamental principle of value investing. It means that investors should only buy stocks that are trading at a significant discount to their intrinsic value. This approach helps to minimize the risk of losses in case the market does not realize the stock’s true value.
  2. Long-Term Perspective: Value investing is a long-term investment strategy. Investors who follow this approach hold onto their stocks for many years, waiting for the market to recognize their true value. This is why value investing is often associated with a buy-and-hold strategy.
  3. Focus on Fundamentals: Value investors focus on a company’s fundamental metrics, such as its earnings, cash flow, and book value. They look for companies that have a strong balance sheet, a competitive advantage in their industry, and a history of consistent earnings growth.
  4. Patience: Value investors need to be patient. They are willing to wait for the market to realize a company’s true value, even if it takes several years. This requires discipline and the ability to resist the temptation to sell a stock too soon.

How to Apply Value Investing

To apply the principles of value investing to your own investments, you should follow these steps:

  1. Conduct Fundamental Analysis: Conduct a thorough analysis of the company’s financial statements, including its earnings, cash flow, and book value. Look for companies that have strong fundamentals and a history of consistent earnings growth.
  2. Determine Intrinsic Value: Use a valuation method, such as discounted cash flow analysis or price-to-earnings ratio analysis, to determine the stock’s intrinsic value. This will help you determine whether the stock is undervalued or overvalued.
  3. Assess the Margin of Safety: Determine the stock’s margin of safety, which is the difference between its intrinsic value and its current market price. Look for stocks that have a significant margin of safety, which will help protect your investment in case the market does not realize the stock’s true value.
  4. Monitor Your Investments: Keep a close eye on your investments and monitor the company’s financial performance. If the company’s fundamentals deteriorate or if the stock’s price increases significantly, it may be time to sell the stock.

Conclusion

Value investing is a popular investment strategy that has been used by many successful investors to achieve long-term financial gains. This approach involves identifying companies whose stock price is undervalued by the market and holding them for a long time until the market realizes their true value. By following the principles of value investing, conducting fundamental analysis, determining intrinsic value, assessing the margin of safety, and monitoring your investments, you can apply this strategy to your own investments and potentially achieve significant long-term returns.

Want to start value investing?

It can be daunting to start value investing, there are so many resources, platforms, books, and individuals with their own opinions on the topic. That is why we came up with a tool to help you! Our tool combines a few of your educated assumptions and years of knowledge we have gathered from research on the topic. The value that you will receive is a process that is fully rational and shields you from making irrational decisions during price swings and of course to identify opportunities. So what are you waiting for?! Get our tool today!