

As we discussed in our previous post, there are a lot of factors to consider when you start your value-investing journey. In this article, we outline our 5 steps to making a purchase decision. Ready? Let’s go!
1. Find industries within your comfort zone
The first step is to find companies that you are interested in investing in. One of the tips Peter Lynch gave in his best-selling book “One Up On Wall Street: How to Use What You Already Know to Make Money in the Market” is to find an industry that is close to your work or interests. In my short professional career, I have been working in the travel, finance, consumer goods, and advertising industry. These are the industries I know most about, and keep regular tabs on which makes it a great place to start. Are there any companies that you know perform well, but are out of the spotlight. Have you heard rummors of a potential acquisition of your favourite clothing brand by a bigger player? These are the starting point of finding hidden gems!
2. Indicate companies that might be undervalued
This step might be a bit harder. There are so many indicators of a good company by just looking at various ratios. Our personal favorite is the PE ratio. Considering that the market average PE ratio is between 20-25, anything under that might indicate a good opportunity so swoop it up in your portfolio. For this case study we will use Urban Outfitters ($COLM). At the time of writing this article, the PE ratio is around 18.0.
3. Check company financial health and foundation
Some important metrics to consider:
- Has the company been growing their revenue?
- Has the company been growing their net income?
- Has the company been growing their net income?
- Is the company’s long-term debt covered by their free cash flow?
- Is the company diluting it’s shareholders?
- Have they been growing their dividends?
Our tool will answer all these questions for you in a wink of an eye:
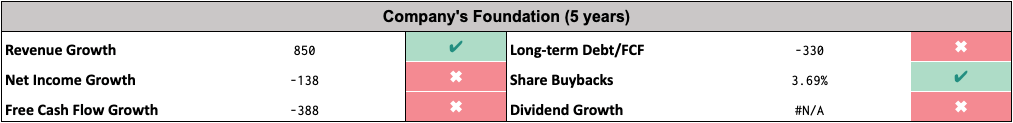
This by itself does not provide you with the full picture, but if you are searching for high-quality companies, this first step will tell you whether to keep investigating this company or move on! For the sake of this article, we will continue with Urban Outfitters.
The following questions you should now ask yourself are regarding the competitive advantage of the company.
- Are they able to transform revenue into profits?
- What is their interest expense ratio?
- Does the company invest heavily into R&D?
- Is it easy to sell the products, meaning, do they have a low Selling and General Expense Ratio?
- Do they have a lot of inventory which is depreciating?
Again, our sheet does the math for you!
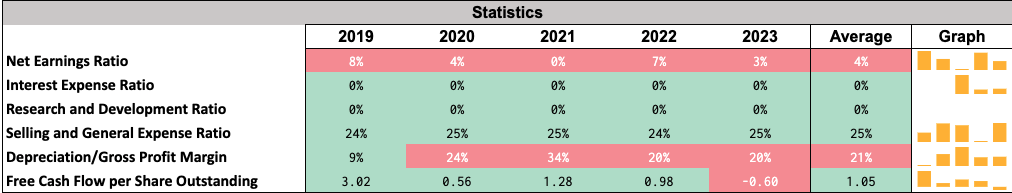
There is some good, some bad, and some ugly. First, they are not able to transform their revenue into profits, which leaves some room for the optimization of the business model. This is not what we are looking for, we are looking for businesses with good 20%+ Net Earnings Ratios.
The interest expense ratio is good. Research and Development Ratio of 0% is good. Any company with a Research and Development Ratio below 20% is considered good. This is because they have products and services that people want and they do not have to develop this further.
Selling and General Expense Ratio is a bit on the high side. This ratio explains that they need to invest on average 25% of their budget into marketing to move products. We would like this ratio to be below 20%.
The depreciation of gross profit margins should ring alarm bells. Urban Outfitters has an average yearly depreciation ratio of 21%! This might be an indication that they consistently have a lot of unsold items still in inventory.
4. Put a price on the stock
By now, I would probably have stopped investigating this company. But for the sake of this article, we will dive deeper into the valuation mechanics of our tool.
First, we need to know the average expected growth per year. We can find analysts’ opinions on Yahoo Finance. They estimate an average yearly growth of 27% for the next five years… I find that hard to believe. Looking at the average revenue growth of the past 5 years, they have increased their revenue by 6% which is probably more realistic.
Next, we need to find their average P/E of the past years. We can use Macro Trends to help us to estimate this number. Ignoring the outliers, they had a high PE of around 18, and a low of 8, which would give us an average P/E ratio of 13.
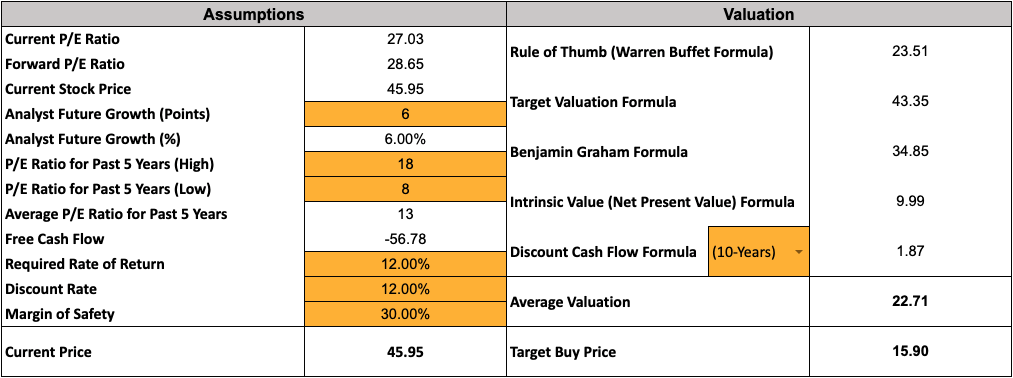
Our tool returns an average valuation of 22.71$, and a target buy price of 15.9 considering a margin of safety of 30%
5. Buy or pass on the stock and repeat.
In this example, we would probably skip on the stock. The company’s foundations are not attractive, and the current price is three times as high as where you might want to consider buying.
Concluding remarks
Does this process appeal to you? Good news, you can acquire our tool today!