
After successfully activating your 9-thirty sheet you can follow these easy steps to make the best use of 9-thirty.
Company Overview
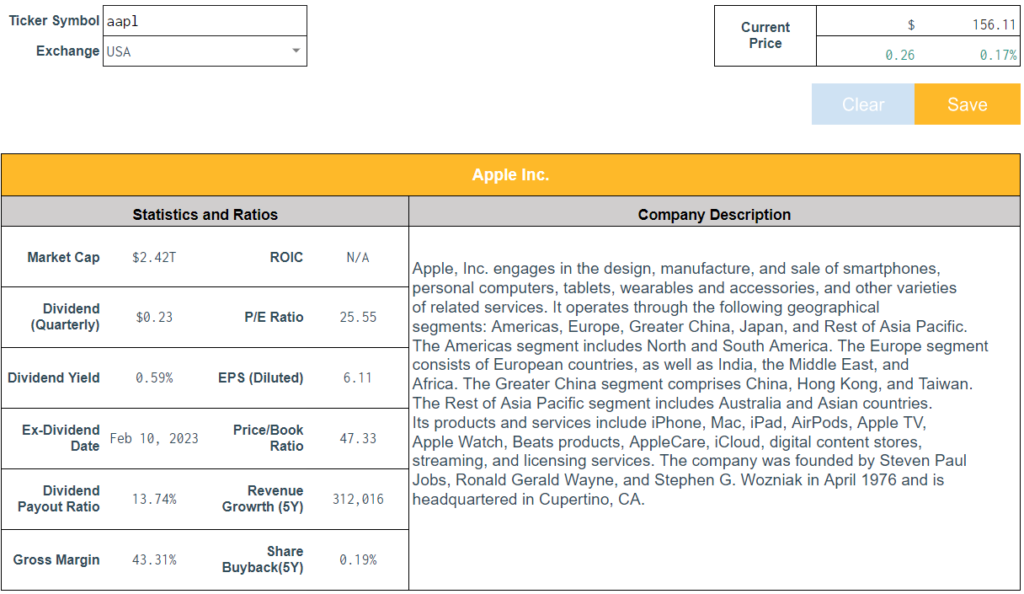
When you enter a ticker symbol and the stock exchange where the following company is traded, you will see some core information about the company as well as some key financial metrics, such as market cap, information about the dividends the company pays, EPS, Return on Invested Capital, etc.
Company’s Foundation
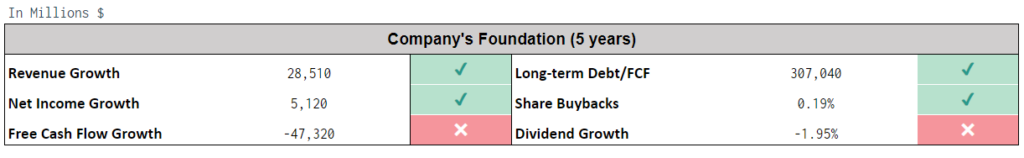
Next, you will see Six key metrics we use to assess the foundation of the company and its performance over the past 5 years:
- Revenue growth
- Net income growth
- Free cash flow growth
- Long-term debt to Free cash flow ration
- Share buybacks
- Dividend growth
These are very quick ratios you can use to quickly assess whether the company’s financial performance you wanted to check meets your standards even before digging deep into the financial statements and annual reports. Simple and quick!
Key Financial Figures
If you want to further research the chosen company, we have you covered!
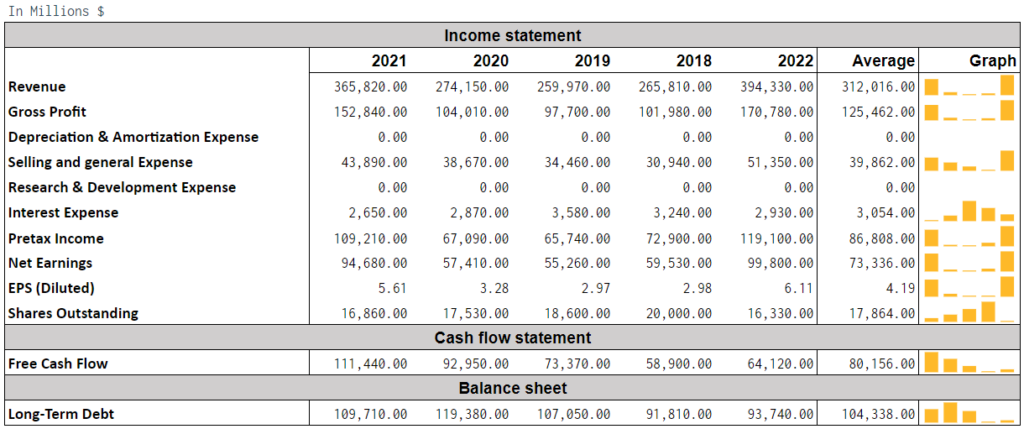
You can further check the core items of the company’s Income Statement, Cash flow statement, and Balance sheet and see in greater detail how the company has performed over the past 5 years and check any trends or inconsistencies to do further due diligence.
Statistics
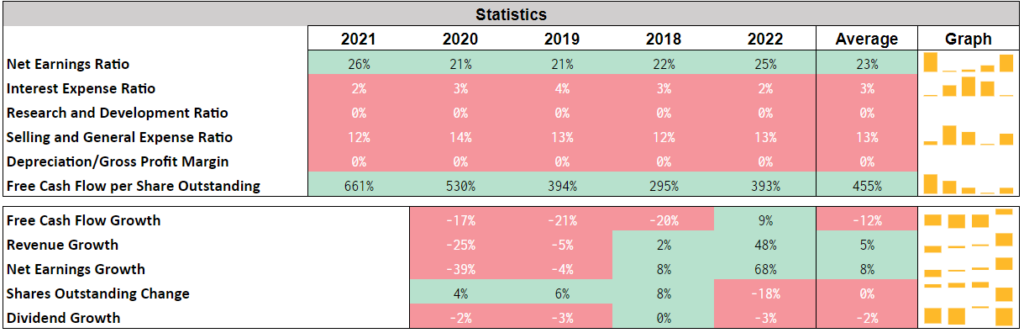
Next, you will see a wide range of ratios and statistics that can provide a detailed overview of the company’s performance from many angles, including its margins, earnings, expense, and growth ratios.
If Warren Buffet, Charlie Munger, and other greatest minds of investing use them, there is definitely something important to consider then!
Fundsmith Investing Ratios
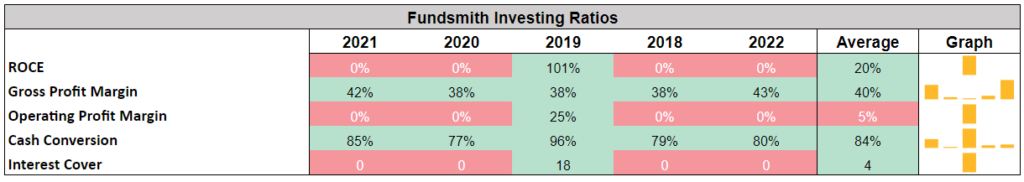
On top of that, 9-thirty was greatly inspired by the outstanding performance of the Fundsmith investment fund under Terry Smith’s management, which has shown as high as 14.89% of annual returns to its shareholders. Therefore, we just could not pass by and decided to include the ratios the Fundsmith managers use for the assessment of their potential holdings.
Revenue (or Free Cash Flow) Growth over Past 10 Years

When you want to get to the most valuable functionality of 9-thirty: the valuation calculator, you can also use this field from external resources to find a reference for the future growth of the company. Just copy-paste the revenue of free cash flow of the company over the last 10 years and you will see the average in the orange box.
Valuation & Assumptions
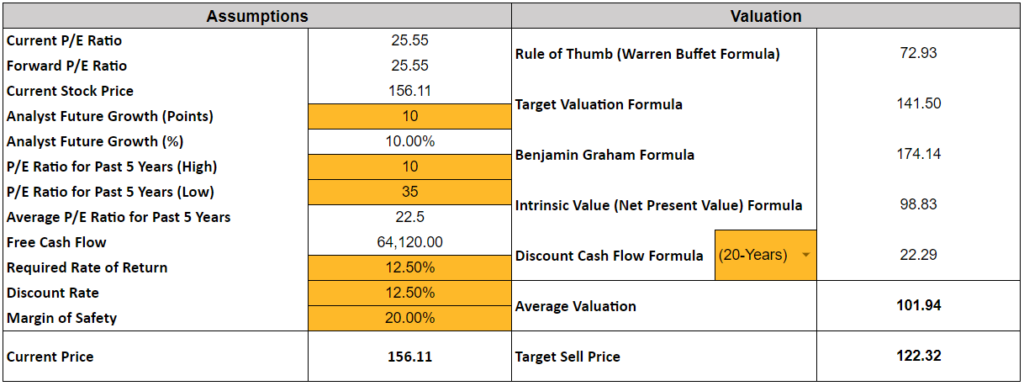
Lastly, when you would like to find the true value of the stock of the company our Valuation Calculator will do that for you!
The only thing you have to do is to fill in the assumptions in orange boxes which include the following:
- Your or the analyst’s future growth expectations
- The average Price-to-Earnings Ratio for the past 5 years of the one you expect in the future.
- Required rate of return
- Discount rate
- Margin of safety
- And the time horizon for the discounted cash flow valuation formula
Based on your provided assumptions, our stock valuation calculator will provide an estimated fair value of the stock based on five different valuation formulas.
For your reference, you can either use the average price provided by all of them or rely on only specific one or two. It is all up to you!
Watchlist and Valuation Tracker


If you would like to track the performance of a particular stock against your estimated fair value, you can easily do that by clicking a “Save” button on the “Dashboard” tab. The main information will be saved in your Watchlist and Valuation Tracker where you can easily follow the price changes and make buy or sell decisions accordingly.